Using an IDE
This topic describes how to use xds-gdb from within an Interactive
Development Environment (IDE) to debug your application.
The topic uses the
NetBeans IDE as an example.
Prerequisites
Before using the IDE, you need to declare the project you want to debug
on the xds-server.
NOTE:
The project you declare can also have been built using XDS. For information on building the project using XDS, see the "Create your first AGL application" section.
NetBeans
This section presents an example using NetBeans version 8.x:
-
Select the Options item in the Tools menu.
-
Open the Build Tools tab.
-
Open the C/C++ tab and click the Add button to reveal the "Add New Tool Collection" dialog box:
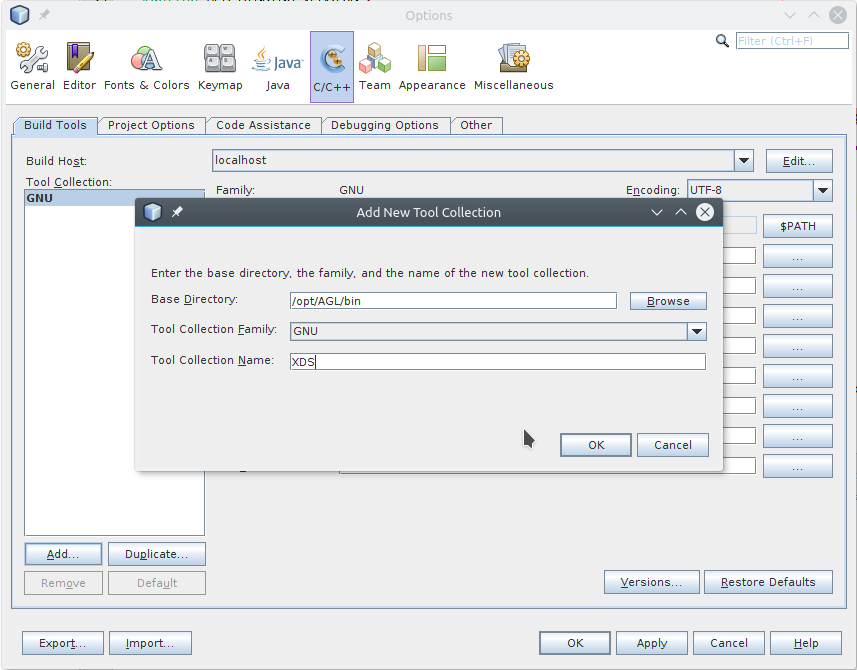 {:: style="width:90%; max-width:700px; margin:auto; display:flex"}
 -
Fill in the Make Command and Debugger Command fields so that they point to the XDS tools. Following is an example:
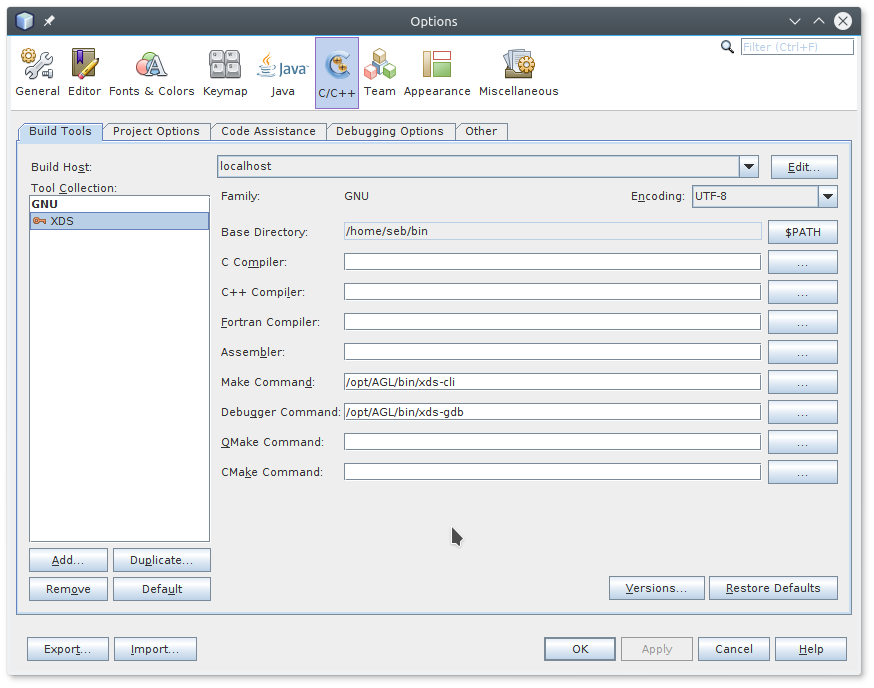 {:: style="width:90%; max-width:700px; margin:auto; display:flex"}
 -
Click on OK button.
-
Select the Project Properties item in the File menu to update your debug settings.
-
In the "Project Properties" dialog, be sure that the "Gen3 board" appears in the "Configuration" field (i.e. active).
-
In the "Categories" navigation pane, select Run.
-
Set the following:
-
Run Command:
target/start-on-root@renesas-gen3.shNOTE:The script name could depend on the
RSYNC_TARGETvariable you set in pre-build command. -
Run Directory:
build_gen3 -
In the "Categories" navigation pane, select Debug.
-
Set the following:
-
Debug command:
/bin/true -
Working Directory: Leave this field blank
-
Gdb Init File:
target/gdb-on-root@renesas-gen3.iniNOTE:
The script name could depend on the
RSYNC_TARGETvariable you set in pre-build command.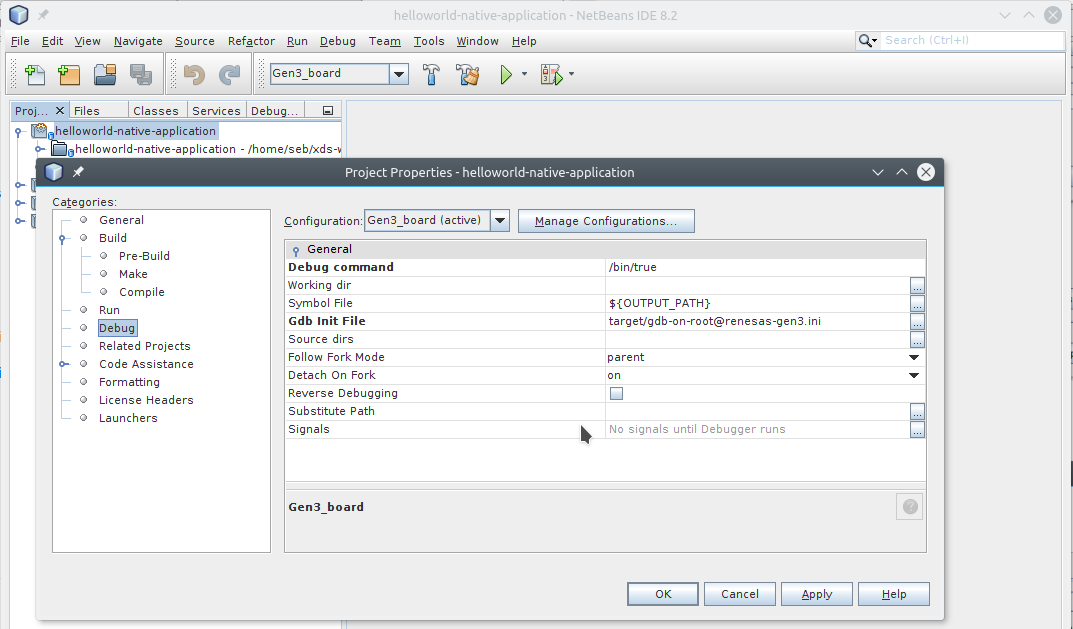 {:: style="width:90%; max-width:700px; margin:auto; display:flex"}
 -
-
Click Apply.
-
Click OK to save your settings.
-
Start debugging your application by selecting the Debug Project item in the Debug menu, or by entering the CTRL+F5 shortcut.